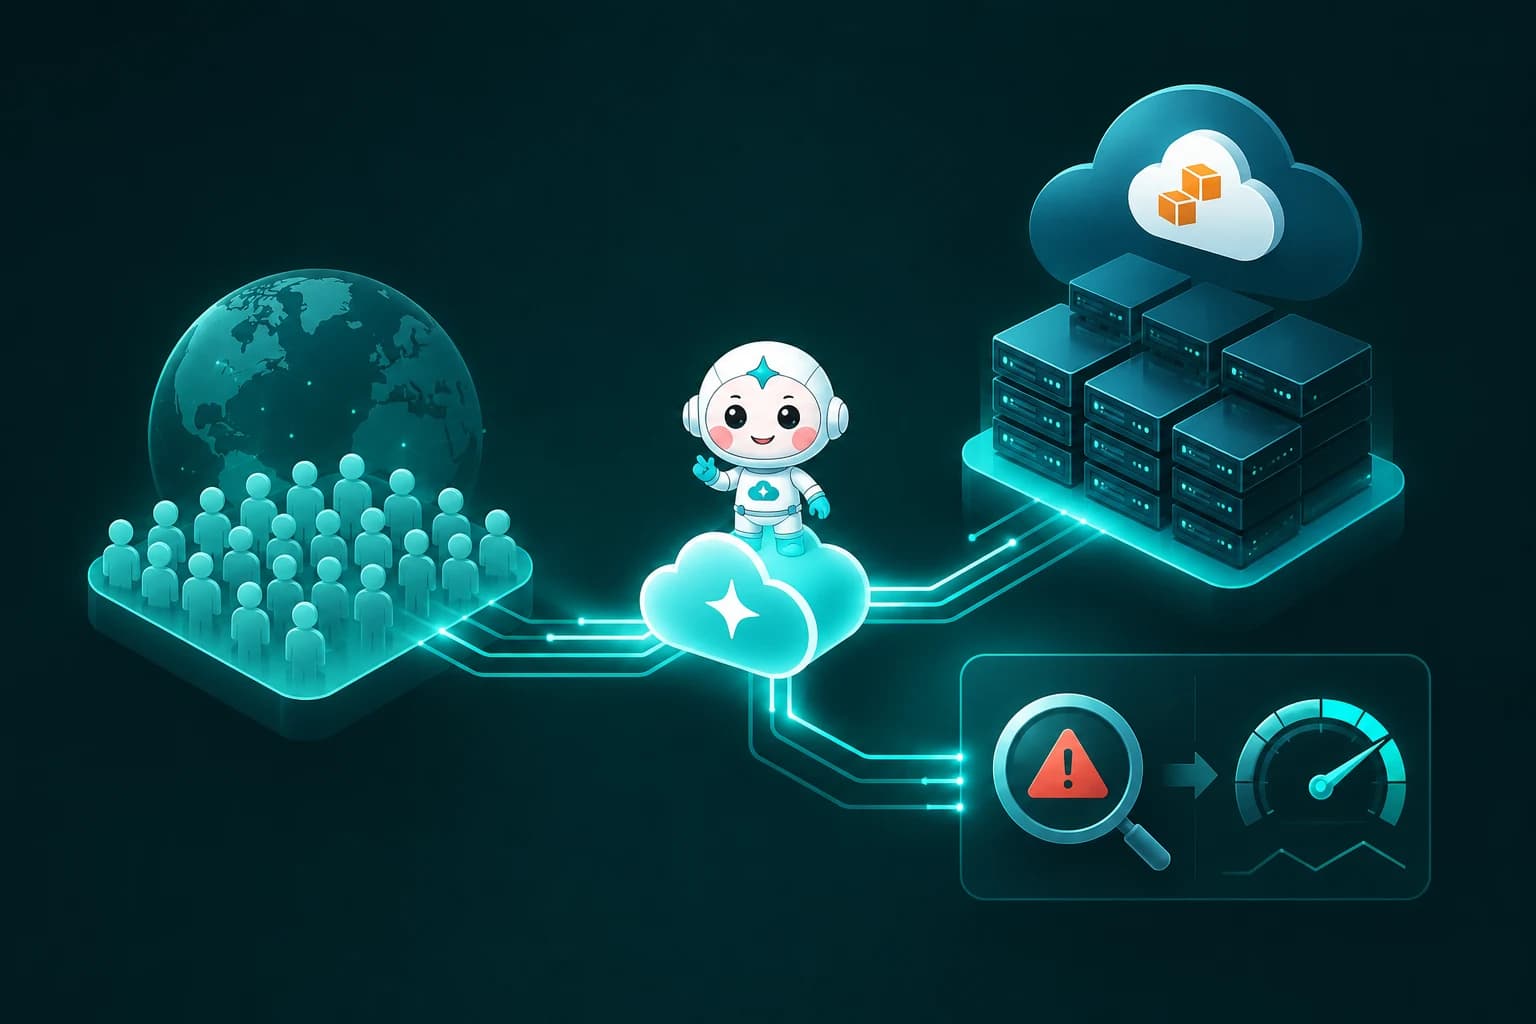
How Amela Turned AWS Incidents from Hours into Minutes with CloudThinker
It's the busiest hour of the day. Thousands of users are on the app at once, p99 latency has doubled, and the error rate is climbing. The on-call has the CloudWatch console in one tab, application logs in another, the database dashboard in a third, and a deploy channel in a fourth. Each tab shows a symptom. None of them says where it started.
That was the pattern at Amela. The team runs a high-traffic application on AWS, serving thousands of concurrent users with sharp spikes at peak time. As the platform grew, so did its complexity, and finding out why something broke could take hours. Those hours landed at the worst moments of the day.
This is how Amela hardened its AWS foundation with a Well-Architected review and, with CloudThinker's Deep Response Engine and Pulse, cut incident response from hours to minutes: root cause and a validated fix in under 30 minutes.
About Amela
Amela operates a consumer-facing application on AWS built for scale. At peak, thousands of concurrent users (CCU) hit the platform at once, driving load far above the daily baseline. The system has to stay responsive exactly when demand is highest, which is also when a small problem does the most damage.
Getting to that scale meant composing many AWS services into one system. That composition is what made the platform powerful, and also what made it hard to operate.
Why the traditional incident workflow breaks at this scale
Any given user request on Amela's platform touched several services, and a slowdown in one could surface as a symptom in another. The usual way of working an incident falls short here for structural reasons, not because anyone was slow.
Symptoms and causes live in different places. A latency alarm fires on the load balancer. The cause might be a release, a database that runs out of connections only at peak concurrency, a retry storm between two services, or an AWS quota that is never reached on an ordinary afternoon. The alarm tells you where it hurts, not where it started.
01Application
Code and config
A release or a feature flag changes how a hot path behaves under load.
02Data
Database layer
Connections, locks or a slow query that only bite at peak concurrency.
03Network
Between services
Timeouts and retries that turn one slow hop into a cascade.
04Platform
AWS limits
A quota or throttle that is never reached on an ordinary afternoon.
Every hypothesis is checked by hand, one at a time. An engineer opens CloudWatch, then Logs Insights, then CloudTrail, then the deploy history, and builds a timeline in their head. Each check takes minutes, and the next check depends on what the last one showed. With four plausible starting points, that serial loop is where the hours go.
The cloud moved faster than the team could harden it. Cloud capability had outpaced the team's ability to keep every corner of the platform hardened and observable. Gaps nobody had time to close (missing health checks, timeouts that amplify failures) turned minor incidents into long investigations.
Alerts arrive after impact. Threshold alarms fire when users are already affected. The slow drift that precedes an outage rarely crosses a static line until it's too late to get ahead of it.
The result was a painful pattern: incidents that should have been minor took hours to resolve, because most of that time went into understanding what had actually gone wrong.
Three steps, in order
01Harden
Well-Architected
Reliability, scalability and security gaps found and prioritized.
02Respond
Deep Response Engine
Root cause and a validated fix in under 30 minutes.
03Prevent
Pulse
Weak signals clustered and surfaced before users feel them.
1. Harden the foundation: a Well-Architected review
Before changing how incidents were handled, CloudThinker started where the AWS Well-Architected Framework recommends: with the architecture itself. Reviewing the platform against the Framework surfaced concrete improvement areas across several pillars, each with a prioritized path to remediation.
- Reliability. Single points of failure, missing health checks, and retry and timeout behavior that amplified small failures into cascading ones. Hardening here meant the system failed less often, and when it did fail, it failed in more predictable, contained ways.
- Performance efficiency and scalability. Scaling policies, resource limits and bottlenecks that only showed up under real load were tightened, so the platform could absorb peak-time CCU spikes.
- Security. Least-privilege access, network segmentation and exposure were hardened, closing the gaps that scale tends to widen.
The review gave Amela something it hadn't had before: a clear, prioritized picture of where the system was fragile, and a plan to make it sturdier before the next peak.
2. Respond in minutes: the Deep Response Engine
Hardening reduced how often incidents happened. CloudThinker's Deep Response Engine (DRE) changed how the remaining ones were handled.
DRE works an incident the way an experienced site reliability engineer would, except the checks run in parallel. It correlates telemetry across the whole stack at once: AWS infrastructure, application logs, metrics and the most recent changes. Instead of a person hopping between dashboards to assemble a timeline, DRE assembles it, points to the most likely root cause, and cites the evidence behind that conclusion.
3. Get ahead of incidents: Pulse
Fast response is good. Not having to respond is better. Pulse gave Amela early detection: it clusters weak signals and surfaces emerging problems before they become customer-facing incidents. The team started seeing the leading indicators (the slow drift, the creeping error rate, the pattern that precedes an outage) early enough to act ahead of them.
What a DRE investigation looks like
01Signal
Alert fires
p99 latency or 5xx rate crosses its threshold at peak.
02Frame
Hypotheses
Release, database, network or an AWS limit. Each predicts different data.
03Check
Evidence
Metrics, logs and recent changes pulled in parallel.
04Decide
Root cause
The reading the evidence supports, with the evidence cited.
05Close
Validated fix
A proposed fix the team approves, then watches hold.
The walkthrough below is illustrative. It shows the shape of a peak-time investigation on a stack like Amela's, with resource names and values made up for the example. It isn't a transcript of a specific Amela incident.
The signal. At 19:04 local time, p99 TargetResponseTime on the production load balancer doubles and the 5xx count starts climbing.
The readings. There are four plausible starting points, and each one predicts something different:
- A release would show a change event shortly before 19:04 and errors concentrated in the new code path.
- A database problem would show connections or CPU climbing on the instance before latency did.
- A network or retry problem would show timeouts between specific services, not across the board.
- An AWS limit would show throttling errors in the logs and a flat line where a metric should keep rising.
The checks. DRE pulls the evidence for all four at once. The load balancer latency, minute by minute:
aws cloudwatch get-metric-statistics \
  --namespace AWS/ApplicationELB \
  --metric-name TargetResponseTime \
  --dimensions Name=LoadBalancer,Value=app/web-prod/50dc6c495c0c9188 \
  --start-time 2026-06-18T11:30:00Z --end-time 2026-06-18T12:30:00Z \
  --period 60 --extended-statistics p99
The database connections over the same window:
aws cloudwatch get-metric-statistics \
  --namespace AWS/RDS \
  --metric-name DatabaseConnections \
  --dimensions Name=DBInstanceIdentifier,Value=app-prod-db \
  --start-time 2026-06-18T11:30:00Z --end-time 2026-06-18T12:30:00Z \
  --period 60 --statistics Maximum
Timeouts and throttling in the application logs, bucketed by minute with Logs Insights:
aws logs start-query \
  --log-group-name /app/web-prod \
  --start-time 1781782200 --end-time 1781785800 \
  --query-string 'fields @timestamp, @message
    | filter @message like /timeout|Throttling|too many connections/
    | stats count(*) by bin(1m)'
And recent changes to the database, from CloudTrail:
aws cloudtrail lookup-events \
  --lookup-attributes AttributeKey=EventName,AttributeValue=ModifyDBInstance \
  --start-time 2026-06-18T00:00:00Z
What came back (illustrative). No ModifyDBInstance call and no throttling errors, which rules out a config change on the database and an AWS limit. Database connections climb to the instance ceiling at 19:01, three minutes before latency moves, and the log errors are too many connections, not timeouts between services. The deploy history shows a release that afternoon that raised the worker count per container, so each new task opens more connections than before. At peak, the extra tasks push the pool over the limit.
The finding. In plain words, in the incident channel: the release multiplied connections per task, peak scaling did the rest, and the database is refusing new connections. The proposed fix is to put the per-task pool size back and add a connection proxy in front of the instance, with the rollback step written out. The evidence (the two graphs, the log query, the release) is linked so the on-call can check the reasoning before approving.
That is the work that used to take hours: four hypotheses, checked one after another, by someone switching tabs under pressure.
The outcome
The impact on Amela's incident response was immediate and measurable:
- Mean time to resolution (MTTR) dropped from hours to minutes.
- The team could identify the root cause and a validated solution in under 30 minutes, turning an open-ended investigation into a short, evidence-led workflow.
The fix was no longer a guess. Because DRE surfaced the cause with supporting evidence, the team could act with confidence instead of trial and error under pressure.
| Operational dimension | Before | After |
|---|---|---|
| Incident MTTR | Hours | Minutes |
| Root cause to fix | Open-ended investigation | Under 30 minutes |
| Incident detection | Reactive, after impact | Proactive, ahead of impact (Pulse) |
| Architecture | Gaps across pillars | Hardened (Well-Architected) |
Why this beats the traditional war room
| Traditional incident workflow | With CloudThinker | |
|---|---|---|
| First look | Open four consoles, start clicking | Timeline and evidence already in the channel |
| Hypotheses | Checked one at a time | Checked in parallel, ruled out with evidence |
| Change correlation | From memory or the deploy channel | Pulled from CloudTrail and deploy history |
| Fix | Trial and error under pressure | Proposed with evidence and a rollback step |
| Detection | Static thresholds, after users notice | Weak signals clustered by Pulse, before impact |
| Architecture gaps | Found during incidents | Found in a review, fixed before the next peak |
The deeper difference is where the hours went. Fixing was rarely the slow part at Amela. Locating the cause was, because each check depended on the last one and a person could only run them in sequence. DRE takes over that loop, and the engineer's job becomes judging a finding instead of assembling one.
Gated by design
DRE acts within Auto Mode, so you decide what runs on its own and what waits for approval. Every action carries the alert, the evidence and the reasoning, so the audit trail reads like the incident write-up.
Getting started
You can try the same loop on your own AWS account. Connect it read-only, then ask from chat:
"Our p99 latency on the production load balancer doubled at 19:04. Check the release, the database, service-to-service timeouts and AWS throttling in parallel, and tell me which one the evidence supports. Propose only, change nothing."
"Run a Well-Architected review of the production account. Rank the reliability findings by how likely they are to turn a small failure into an outage at peak."
"Show me signals from the last week that look like the start of an incident but haven't crossed an alarm yet."
Related reading
- Introducing the Deep Response Engine: how Pulse clusters the noise and Incident investigates root cause in parallel.
- How HBlab ships faster and runs cloud 24/7 with CloudThinker: AgenticOps and managed operations at scale.
- How an Australian telematics provider automates day-to-day operations: code review, cost, and a daily health check across a device fleet.
Conclusion
For a high-scale application on AWS, complexity is unavoidable. Slow incident response isn't. Amela hardened its foundation with a Well-Architected review, got ahead of emerging problems with Pulse, and turned incident response from an hours-long investigation into a root-cause-first workflow measured in minutes. The team now spends less time firefighting and more time building.
To see how CloudThinker resolves incidents like these, explore the Deep Response Engine, run a free Well-Architected Assessment, or talk to our team.