How to Use CloudThinker for Incidents: Three Ways, One Night
Three pages in one night. Three different shapes of problem.
The first had a fix that had already worked forty times. The second had never happened before. The third never became a page at all, because one engineer asked a question and got an answer.
Same platform, three different ways through. That is the thing to understand before you wire anything up: CloudThinker does not have one incident workflow. It has three, and the one you use depends on what kind of trouble you are in. A human decides in all three.
This post walks each one, then shows you exactly what to configure to make it available to your team.
Everything starts in the same place
Whichever path an incident takes, it gets there the same way. Raw events arrive, most of them get suppressed, the survivors are grouped, and only what is actually actionable becomes an incident.
From raw event to resolved incident
The numbers in a real workspace make the point better than the diagram does. Thirteen thousand raw events over seven days become 510 signals, then 40 clusters, with 189 signals suppressed along the way.
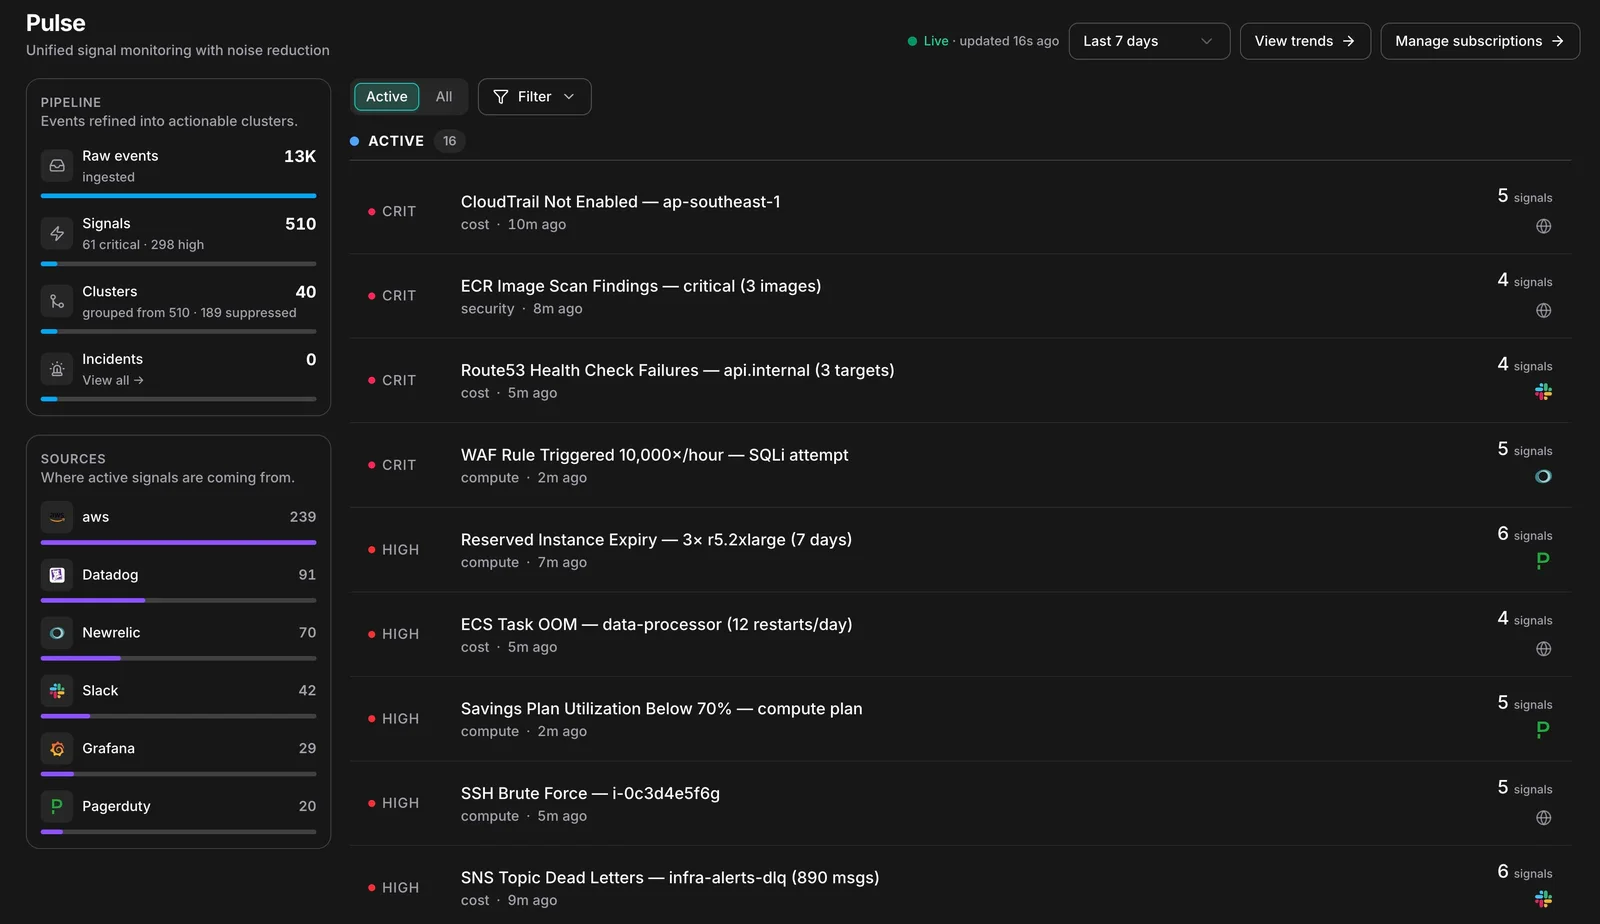
The Pulse feed: 13K raw events ingested, refined to 510 signals, grouped into 40 clusters, with the sources they came from listed on the left.
Everything below happens after this funnel. So does the first thing you should configure.
Path one: the fix is already known
02:14. A disk alarm fires on a log node. /var/log is at 96% and climbing about 2 GB an hour.
Nothing wakes up yet. Two related alarms arrive in the next twenty seconds and get grouped with the first. One cluster, one incident, one page instead of three.
Investigation starts on its own and matches a runbook within seconds: log rotation stuck, seen forty times in ninety days, same fix every time. The cause is specific, logrotate failed on a locked file just before midnight, and 38 GB of rotated logs were never compressed or shipped. The fix is staged: ship the logs to object storage, compress, restart the rotation job. No application data touched.
Then it stops and asks.
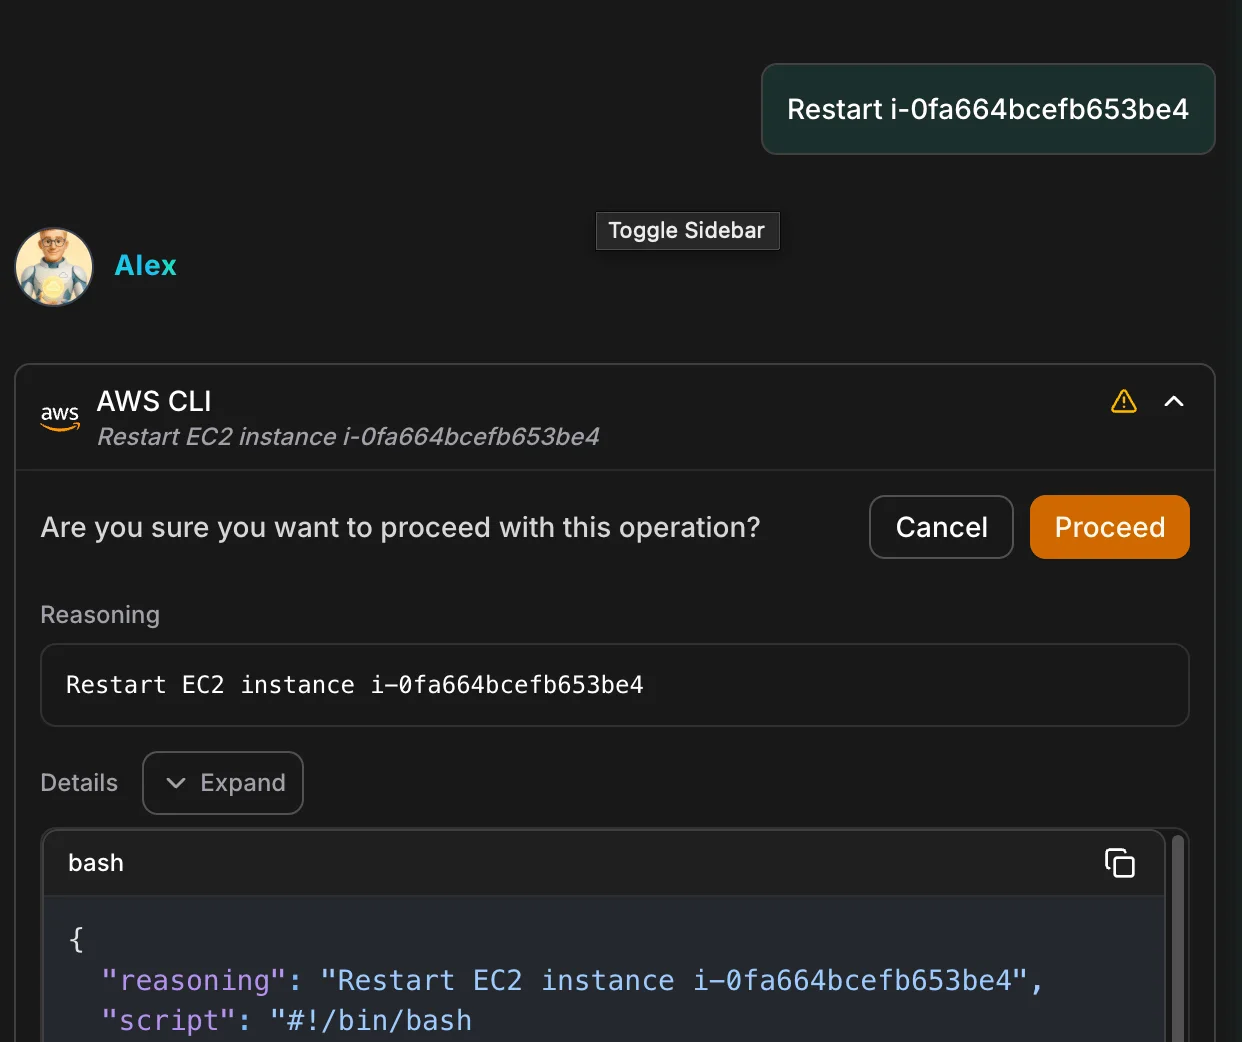
The approval gate in a chat thread: the proposed operation, the reasoning behind it, the exact script, and Cancel or Proceed.
The approval reaches the on-call engineer on their phone. Everything needed to answer is on one card: what happened, why, what the fix does, and what it will not touch. One tap. Four minutes later the disk is at 31% and the alarm has cleared.
Twenty-eight seconds of machine work, one tap of human work, and nobody opened a laptop.
How to set it up
1. Get the events in. Open Resolve → Integrations, pick the platform that owns the alarm, add the connection, then configure a signal path: webhook, polling, or chat. For a webhook, map the JSON fields for title, description, severity, service, resource, and timestamp, and map the sender's severity values onto CloudThinker's. Use fields that stay stable across deliveries, not ones that change per event.
Then send a test event. A 200 response only proves delivery. Go and confirm the signal actually appeared, joined the cluster you expected, and routed the way you wanted.
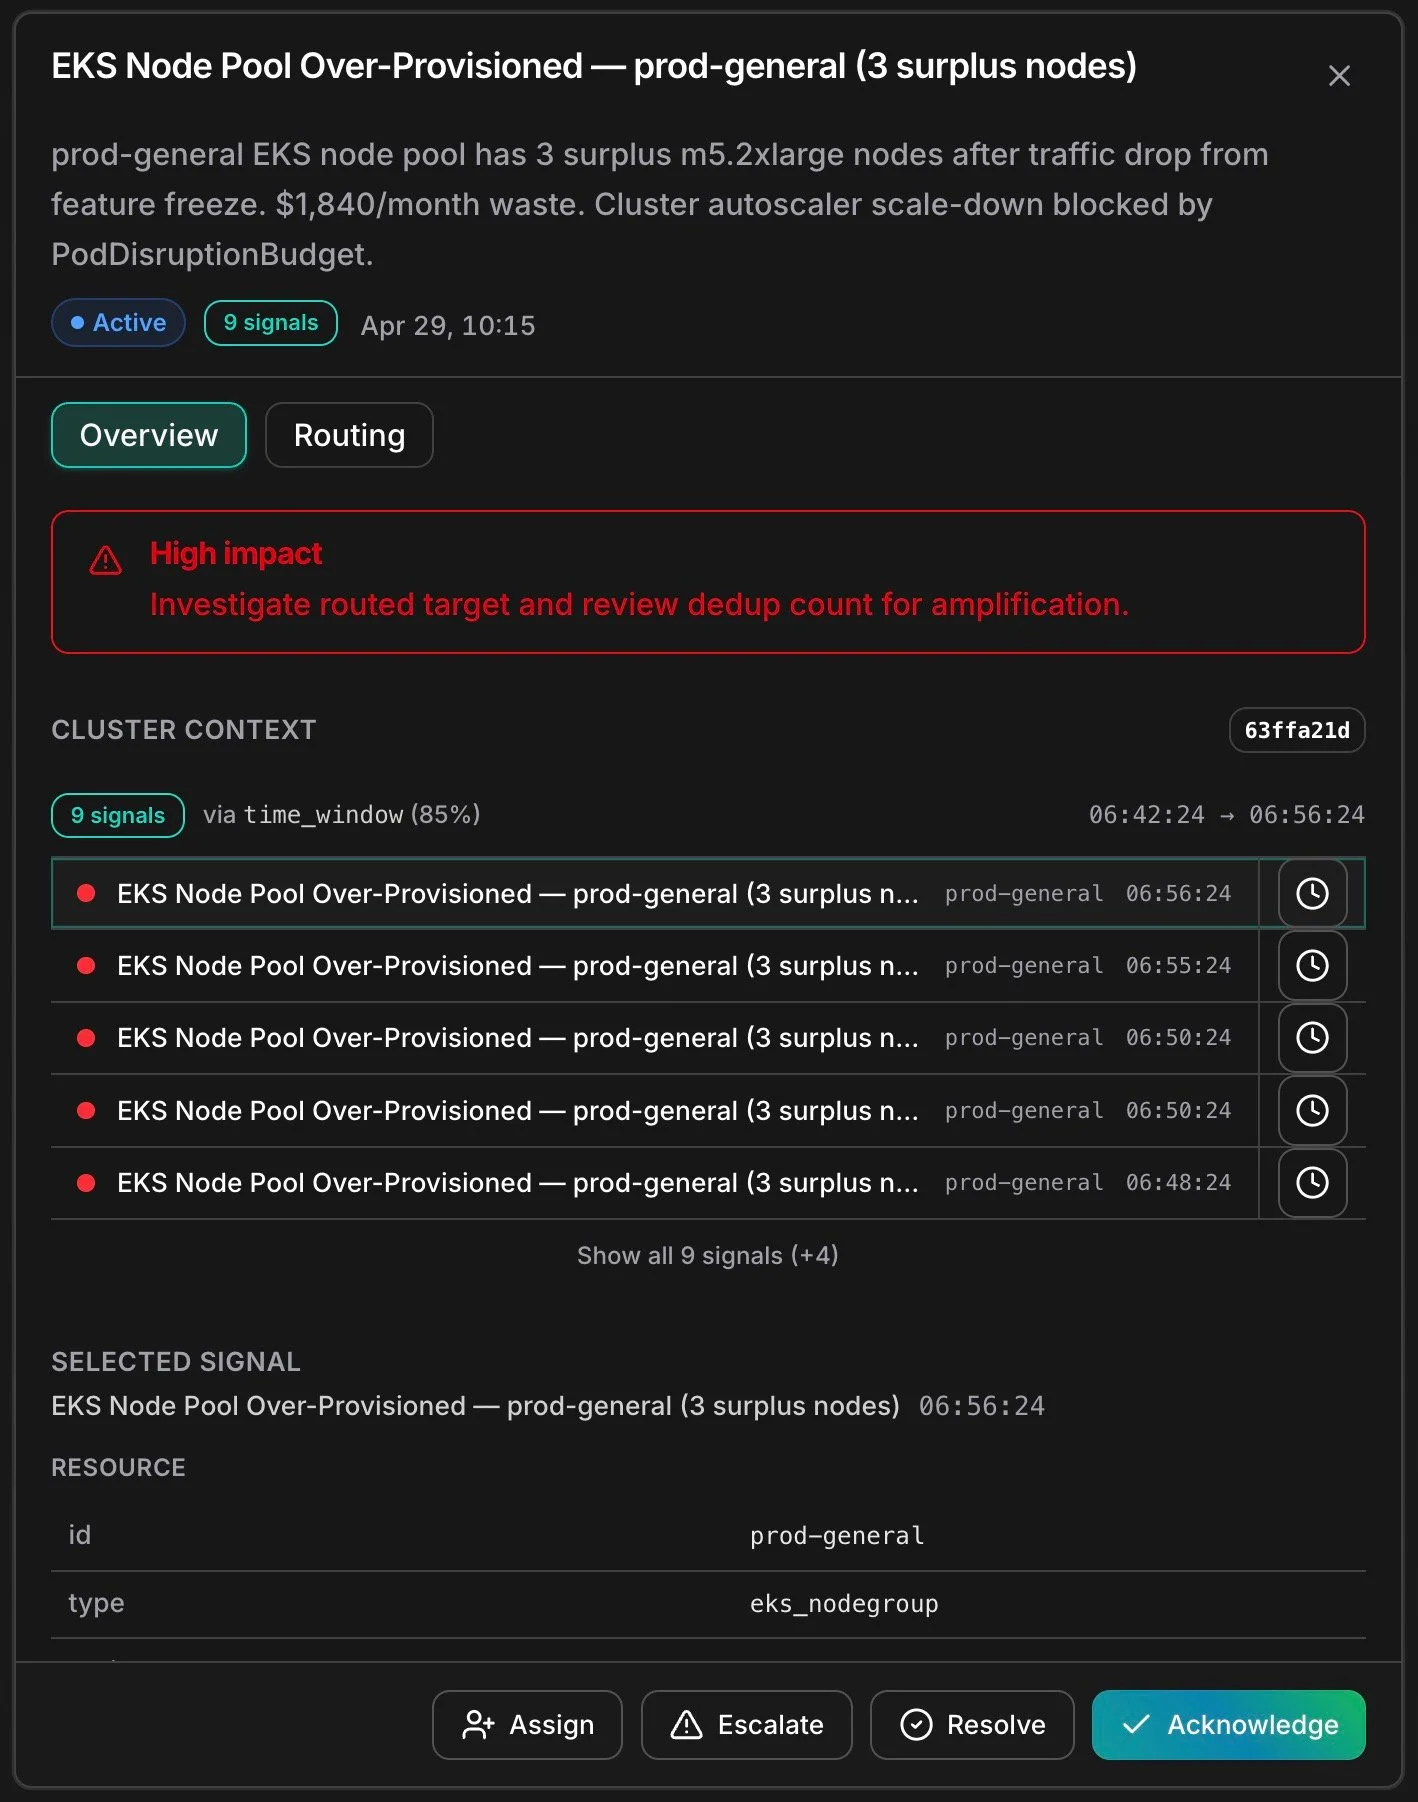
A cluster detail view: nine related signals correlated into one operational problem by time window, with the resource and the acknowledge, assign, escalate and resolve controls.
2. Give it the runbook. Open Resolve → Runbooks and connect where your procedures already live: Confluence spaces or labels, a GitHub repo and branch, a GitLab project, or direct Markdown upload (up to 20 files, 5 MB each). External sources stay in their original system and agents read them during investigation.
3. Decide what it may run without you. Every mutating command pulled out of a runbook gets one of three effects: Allow, Require Approval, or Deny. Read-only investigation commands need no effect at all. A command with no matching effect defaults to Require Approval, so an unrecognized command waits for a person rather than slipping through.
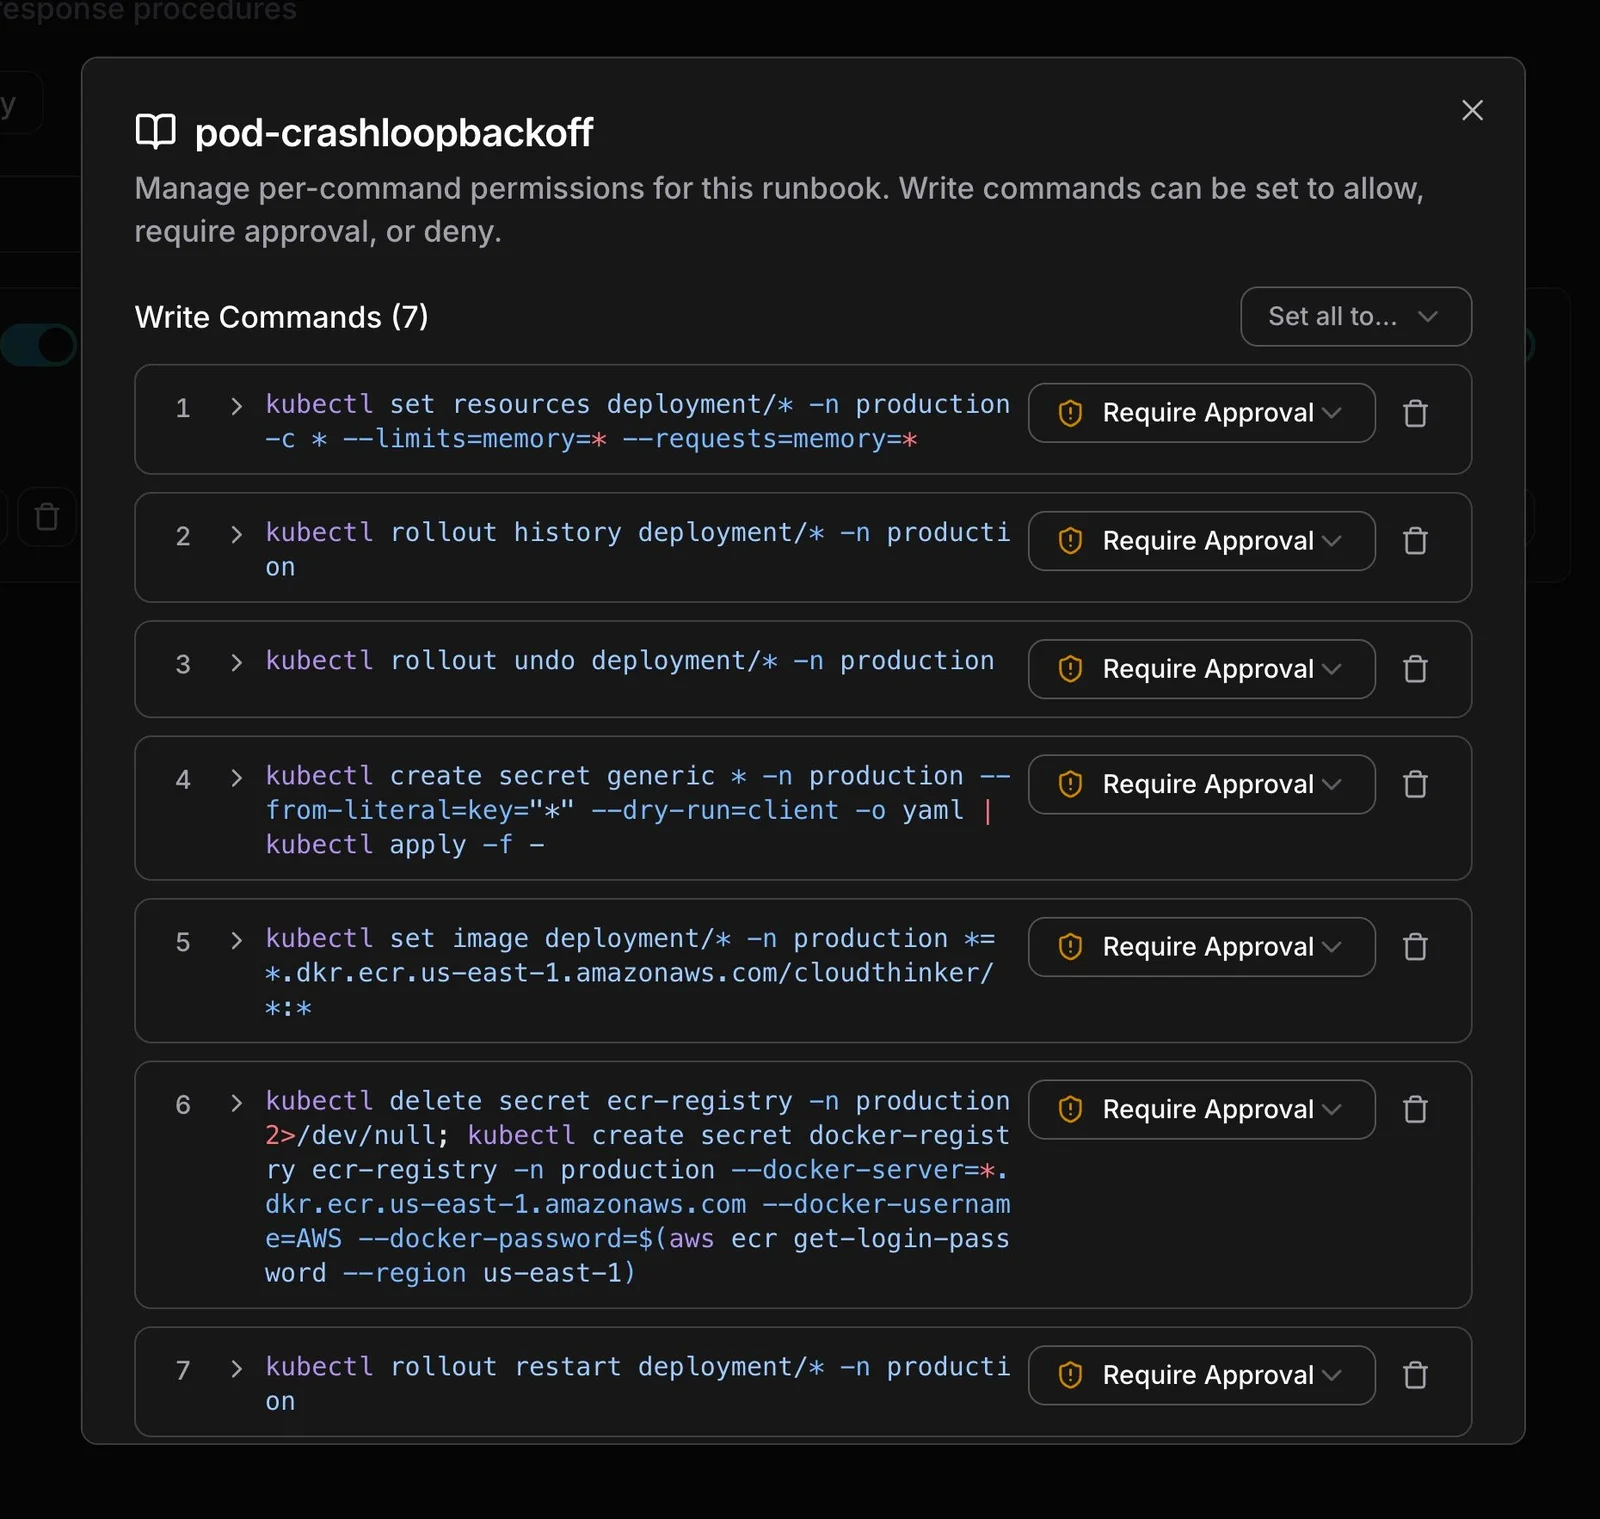
Per-command permissions for a runbook: seven write commands, each set individually to allow, require approval, or deny.
This is the dial that decides how much of 02:14 happens without you. Set it in daylight, once, with the people who own the risk in the room.
4. Turn on automatic investigation, and name the approvers. The workspace On Duty setting in Resolve → Settings controls whether a routed cluster starts analysis on its own. With it off, detection and incident filing still happen, but investigation waits for you to click Investigate. On supported webhooks, automatic investigation is on by default at a minimum severity of Medium.
Then make sure the approval can reach a human at 2 a.m. Approvers live under Approval → Approvers, and notification routing decides which Slack or Teams channel the card lands in.
One honest caveat: not every incident reaches every stage. An investigation can end without a root cause, and a runbook might not match. When that happens, you are in the second path.
Path two: nobody has seen this before
03:40. Checkout starts returning 502s. No deploy that day. Nothing in the runbooks matches, because this has never happened.
An incident room opens in Slack. Three people, four agents, one thread.
The incident lead asks the room the only question worth asking first: what changed in the last six hours, anywhere?
Under a minute later there are three candidates: a firewall rule, a database auto-upgrade, and a certificate rotation. The next answer narrows it. The 5xx errors start at exactly the minute of the certificate rotation, while the other two surfaces stay flat. The third answer confirms it: the leaf certificate is being served without its intermediate, the payment gateway fails the handshake, and the previous certificate is still available. Rollback prepared, waiting for approval.
The lead approves the rollback and asks for a draft of the customer status update.
Root cause in six minutes. Three changes checked, one hypothesis confirmed, and every judgment call made by a person. The agents did the fetching and the correlating.
That investigation is not a chat log you have to reconstruct later. It writes itself up as you go.
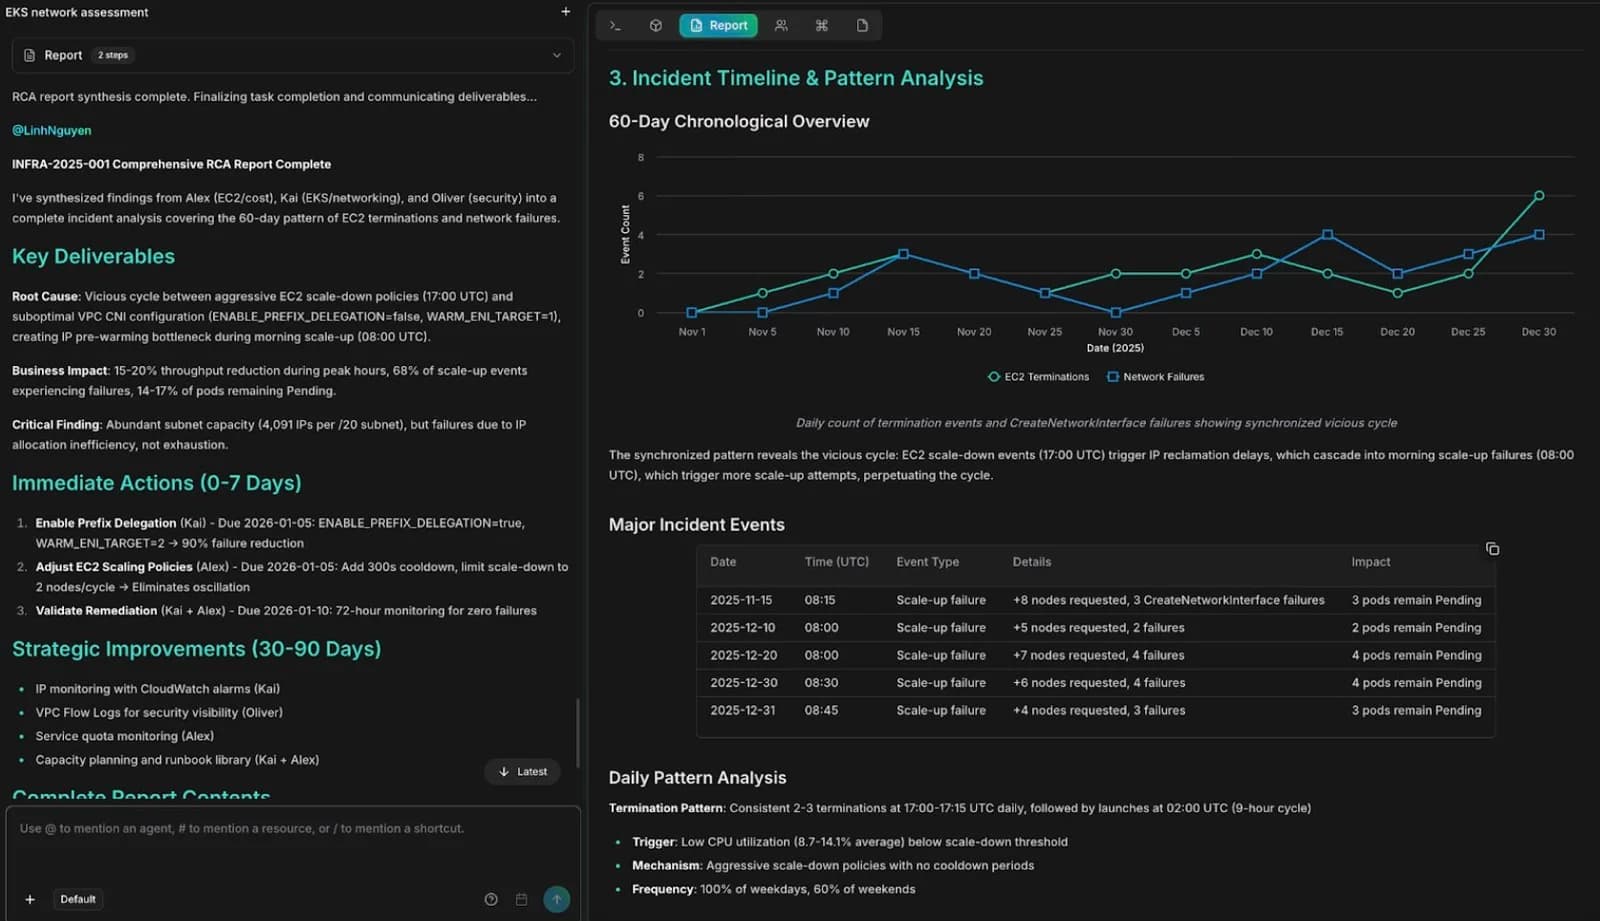
A completed RCA report: root cause, business impact, immediate actions with owners and due dates, and a chart correlating two event types over sixty days.
How to set it up
The room is the channel you already have. Nothing new to open.
1. Connect Slack or Teams. As a CloudThinker organization owner or administrator, go to Admin Settings → Integrations, find Slack, and authorize it. If your workspace has App Approval turned on, a Slack Workspace Owner has to approve the app separately, and that approval is not a substitute for CloudThinker organization access. Teams installs the same way through your org's app catalog.
2. Map every channel to a workspace. This matters more than it looks. The mapping controls which CloudThinker workspace, and therefore which connections, a message from that channel runs against. A message from an unmapped channel runs in the organization's oldest workspace. Map every channel the bot can see, and remove the bot from channels that should not be running prompts.
3. Turn on the war room outcome, with a severity floor. In Resolve → Integrations, select Slack or Teams and open Outcomes. The war room outcome opens a dedicated channel per incident, and it has its own minimum severity: Critical, High, or All. Set it so routine incidents do not each spawn a channel. Outcomes are also where you enable incident updates, follow-up tickets, and draft fix merge requests.
4. Know how to talk in the room. Mention @CloudThinker to start a thread, then reply inside that thread without mentioning the bot again. Plain language works. "What changed in the last six hours" is a perfectly good prompt.
One thing to expect: the postmortem is written on request, not automatically. Ask for it when the room closes. It is an outcome, not a lifecycle state, so requesting one does not change the incident's status.
Path three: this one never becomes a page
14:10. Latency on one API goes from 180ms to 2s. It is the middle of the afternoon. It is annoying, not urgent, and nobody wants to page a team over it.
So nobody does. An engineer opens a chat and asks what changed.
The answer comes back with the deploy log already in hand, nothing pasted in: the release twenty minutes earlier added a synchronous call to another service, whose connection pool is saturated with hundreds of requests queued. Nothing else in that path changed.
Asking for options produces three, with the trade-offs attached. Roll back: two minutes, zero risk. Raise the pool: quick, but it moves the saturation one hop downstream. Make the call asynchronous: the right fix, needs a pull request. The recommendation is the first now, the third this week.
The engineer takes the rollback and asks for a ticket on the third option. Five minutes later latency is back to normal and the ticket exists with the trace and the proposal attached.
One engineer, five minutes, no page, no room.
How to set it up
Almost nothing, because this path runs on what you already connected.
1. Connections are the setup. The agents know your deploy history, your metrics, and your pool configuration because those systems are connected. Connections use scoped credentials, with nothing installed inside your environment.
2. Pick the workspace mode. Open any chat, open Agent settings from the pill to the right of the prompt box, and choose Manual or Auto under Approval. It applies to every conversation in that workspace.
3. In Manual, set tool permissions. Under Chat Settings → Approval → Tool Permissions, each connection tool is Always allow, Needs approval, or Never allow. Reads can pause too, which is useful when a read touches something sensitive. An approval pauses that one call, not the whole conversation.
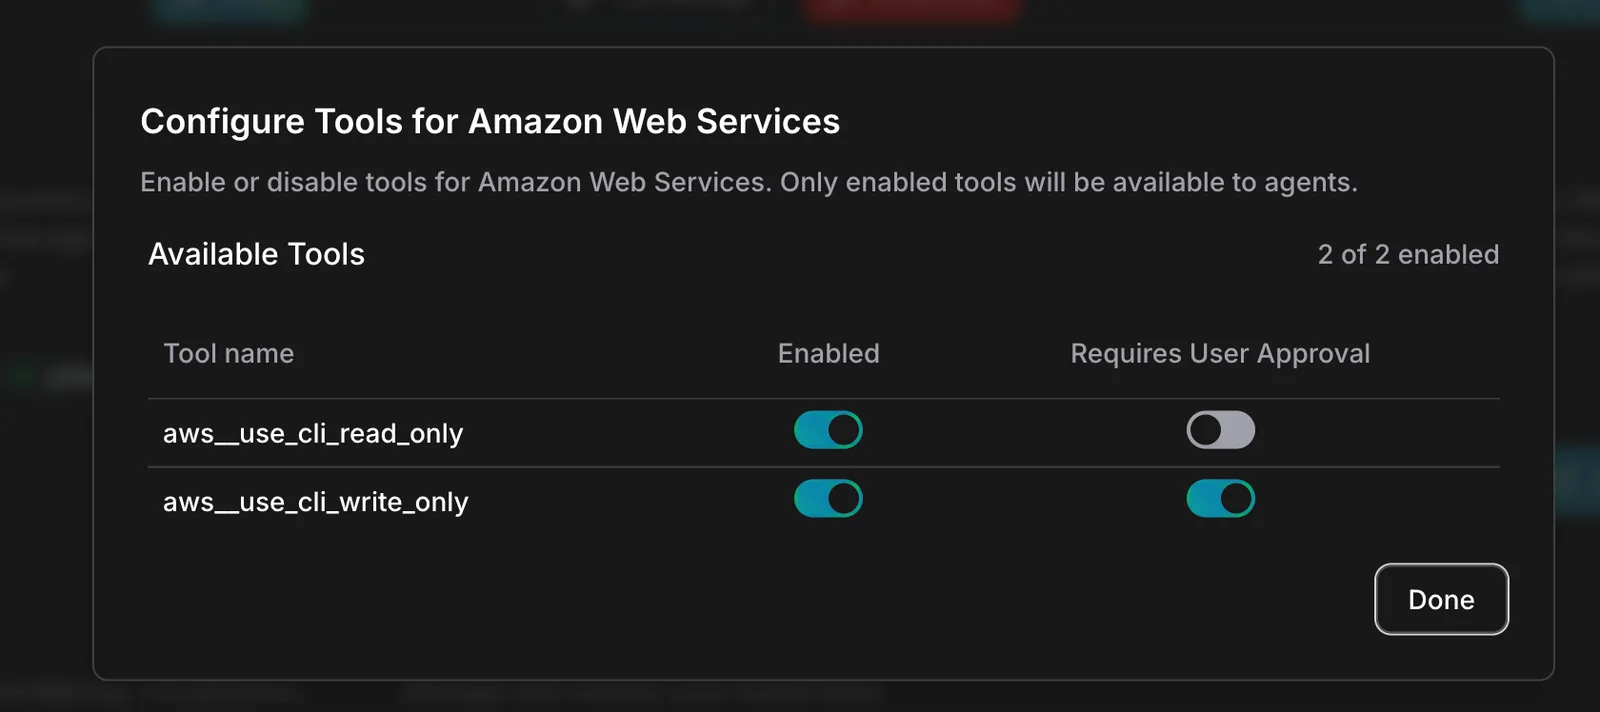
Tool configuration for a cloud connection: each tool can be enabled, and separately set to require user approval before it runs.
4. In Auto, the classifier decides writes. Auto Mode evaluates catalogued write calls before they run, and catalogued reads skip it. Anything it cannot classify is treated as a write, so unknowns get scrutiny rather than a free pass.
Choosing between them
You do not pick a path in advance. The incident picks it, and you recognize which one you are in within the first minute.
Which of the three paths an incident takes
Resolve stages the fix
Approve once, from your phone
An incident room opens
Humans and agents in one thread
You open a chat
Ask, weigh options, decide
Three things stay constant. A human is on every production change. It all happens in Slack or Teams, so there is no new console to learn. And each incident makes the next one cheaper, because resolved incidents write to memory and those lessons come back at the start of a later investigation.
Your first week
A concrete order to do this in:
- Connect one monitoring source and send a real test event. Confirm it reaches Pulse as a signal, not just a 200 response.
- Connect Slack or Teams, and map every channel to a workspace.
- Point Runbooks at wherever your procedures already live. Do not rewrite them first.
- Review the extracted commands and set effects. Start with more Require Approval than you think you need.
- Turn On Duty on and set the severity floor for automatic investigation.
- Turn the war room outcome on at Critical only. Lower it once the rooms are earning their place.
Then wait for a real page. The first one will tell you more than a week of configuration.
CloudThinker's incident work runs on Resolve for detection and investigation and OnCall for the room. For the longer version of how the investigation itself works, Introducing CloudThinker Incidents covers root cause analysis and blast radius, and how to reduce MTTR explains why diagnosis is the stage worth compressing first. Start free with 100 premium credits, no card required.