The Connection Value Ladder: What to Expect in the First Five Minutes, the First Week, and Every Month After
Every engineering team has an integration graveyard. The Slack channel a monitoring tool posts into that everyone muted in March. The dashboard someone built after connecting the billing export, viewed eleven times, ten of them during setup. The ticketing integration that faithfully syncs data in both directions and has changed exactly nothing about how anyone works.
The pattern is always the same: the vendor's onboarding flow celebrates the connection itself — confetti, green checkmark, "You're all set!" — and then the value is deferred. Build some dashboards. Configure some alerts. Come back in a quarter. The connection was never the product; it was a data sink, and you were left holding the shovel.
This is part one of our Connection Value series — seven posts on what should actually happen after you connect a tool to an operations platform, using CloudThinker's 42+ connections as the working example. But the framework here isn't CloudThinker-specific. It's a buying criterion. Hold any vendor to it, including us.
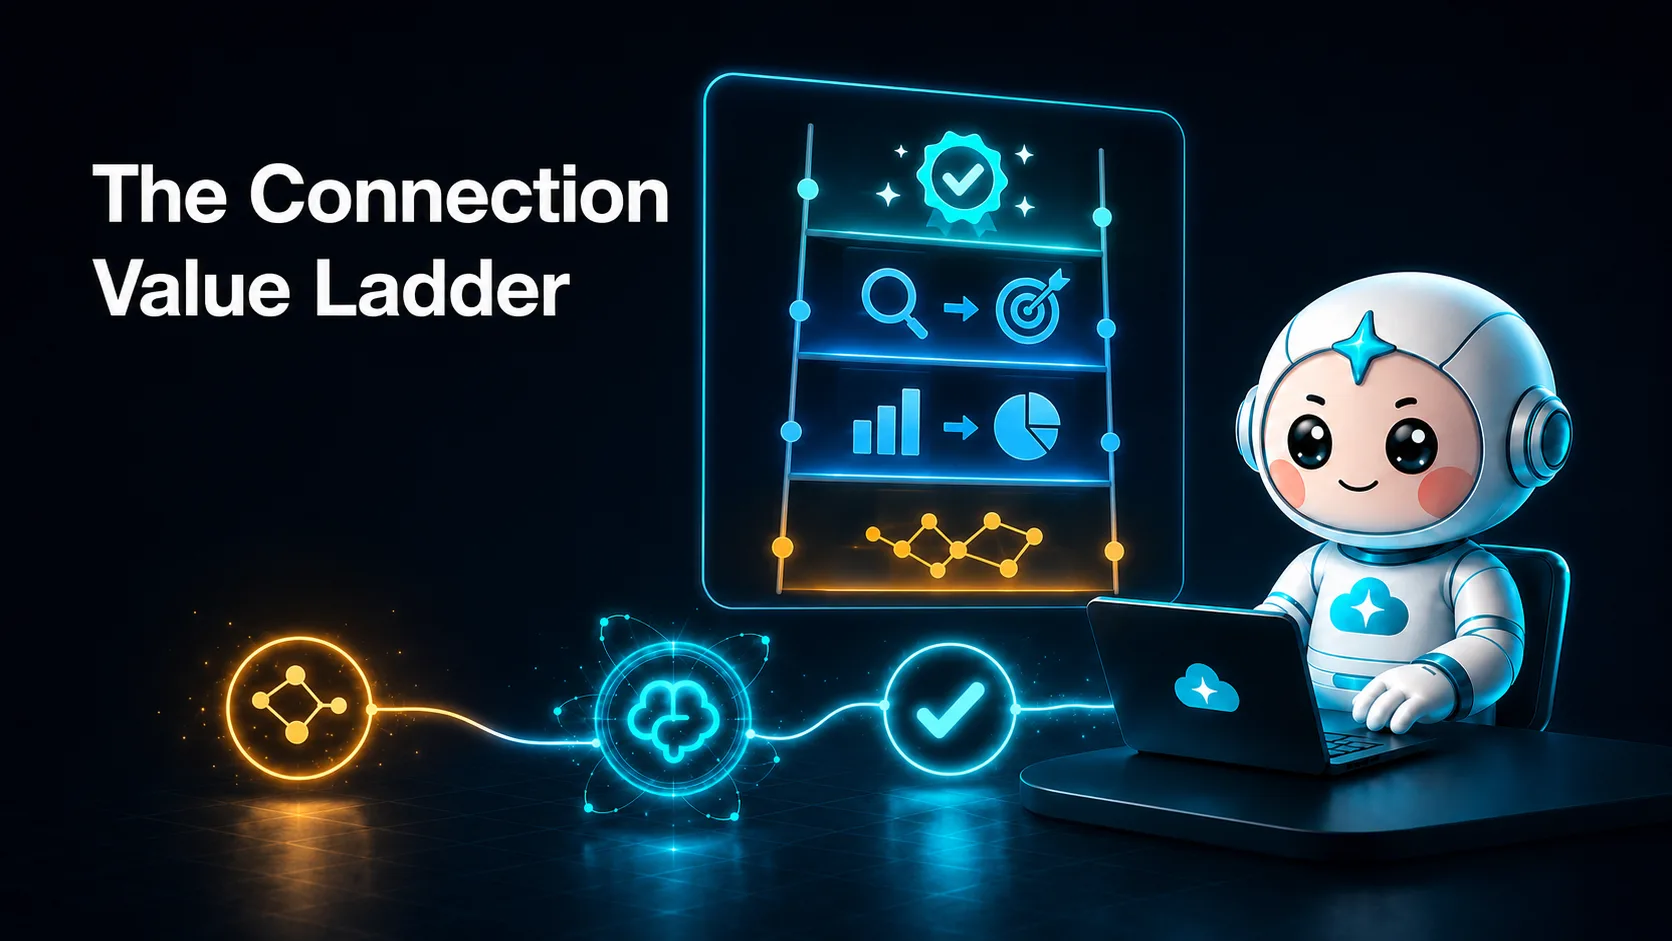
We call it the connection value ladder, and it has four rungs.
The ladder at a glance
| Rung | When | What you should get |
|---|---|---|
| First minute | Right after connect | Auto-discovery plus one concrete, specific insight — zero prompting required |
| First week | Days 1–7 | Baselines learned from your data; a scheduled report that arrives unasked |
| Continuous | Ongoing | Automations gated by graduated autonomy — the agent earns write access |
| Compounding | Every month after | Each new connection makes the existing ones smarter; value visible in one place |
If a tool can't articulate what it delivers at each rung, you're being sold a data sink.
Rung one: the first minute
The test is simple: connect the tool, touch nothing else, and see whether something specific and true about your environment appears — not a tour, not a template, not "explore your data."
What this looks like in practice depends on the connection:
- Connect a cloud account (a read-only role, about five minutes to set up) and the first scan surfaces dollar-figure findings: unattached volumes, idle instances, non-prod environments running around the clock, each with a monthly estimate attached. On a typical mid-market account, the first table lands in the four-to-five-figure monthly range. Part two walks through this in detail.
- Connect a repository and the agent reviews your most recent open pull request — actual comments on actual diff lines, not a promise of future code quality. Part three covers what that first review contains and what it deliberately skips.
- Connect Jira and you get a toil analysis from your ticket history within the hour: which request types recur, which ones follow a runbook-shaped pattern, roughly how many engineer-hours a month they consume. Part four shows a real-shaped example.
- Connect PagerDuty and the agent audits your alert noise: which alerts fired most, which were acknowledged and closed without action, which pages landed between midnight and six a.m. for things that self-resolved. Part five goes deep on this one, including what happens to MTTR afterward.
The common thread: auto-discovery does the inventory, and the first insight is chosen for you because the data itself points at it. You didn't write a prompt. You didn't build a dashboard. You connected, and something you didn't know — with a number on it — appeared.
One honest caveat: the first minute is only as good as the history behind it. A cloud account has months of billing data on day one, so cost findings are immediate and specific. A repo with two open PRs gives the reviewer less to say than a repo with two hundred. The rung still holds — you get a real insight, not a placeholder — but depth scales with data.
Rung two: the first week
A single snapshot is useful once. What matters next is whether the platform learns what normal looks like for you — and starts telling you things on a schedule, without being asked.
During the first week, CloudThinker's agents build baselines from your data: spending patterns per service and per environment, alert frequency by hour and by service, deploy cadence, ticket inflow. Around day seven, anomaly detection switches from generic thresholds to your thresholds — a Tuesday-morning traffic spike that's normal for you stops being interesting; a quiet service suddenly spending 40% more becomes very interesting.
And the first scheduled report arrives. For a cloud connection that's a weekly cost report: what moved, why, and what the open findings are worth. Nobody configured it; nobody had to remember to ask. This is the anti-graveyard mechanism — the connection reaches out to you, on a cadence, with content specific enough that muting it would cost you money.
Rung three: continuous — the agent earns write access
This is where most "AI in operations" pitches get evasive, so let's be precise about how it works here, because it's the trust hinge of the whole ladder.
Every connection starts read-only. Not read-mostly — read-only. The role you grant at connection time carries no write permissions, and the connection guide publishes the exact policy so your security review can verify what is and isn't granted.
Write actions are opt-in, per action type, per environment, at one of four autonomy levels:
- Notify — the agent reports the finding. Nothing else. This is the default for everything.
- Suggest — the agent proposes a specific remediation with projected impact and rollback notes.
- Approve — the agent prepares the action and executes only after a named human clicks approve.
- Autonomous — the agent executes and reports. Teams reserve this for provably safe, reversible actions in non-prod, and typically only after weeks of watching the agent be right at the Approve level.
Everything — every level, every action — is governed by role-based access control and lands in a full audit trail: what was found, what was proposed, who approved, what changed, when. Automations dry-run in a sandbox before touching anything real, and each one is a portable, readable SKILL.md file you can inspect line by line.
So here is what read-only access can see: your costs, your metrics, your alert history, your ticket patterns, your open PRs. And what it cannot do: delete a volume, resize an instance, merge a PR, close an incident, silence an alert, or purchase anything — not without you granting scoped write access and raising that specific action above Notify. The agent earns write access. It never assumes it.
Part six covers the payoff of this rung: how runbook-shaped toil becomes automations that track their own hours saved, so the trust you extend is repaid in numbers, not vibes.
Rung four: compounding — connections make each other smarter
This is the rung the integration graveyard never reaches, and it's the real argument for a platform over a pile of point tools.
A cost anomaly on its own is a question. A cost anomaly plus deploy markers from your connected repo is often an answer: the spike started forty minutes after Thursday's deploy to the ingestion service. The same deploy markers do the identical job during incidents — "what changed?" is the first question in any root cause analysis, and the repo connection answers it before anyone asks.
It runs in every direction. Your Jira history teaches the automation recommender which toil is worth automating first. Your PagerDuty history tells the cost agent which "idle" services are actually on a critical path. Alex's cost findings, Olivier's security findings, and Kai's Kubernetes findings stop being three separate reports about the same cluster and start informing each other.
And the accumulated value is visible in one place — a single view of dollars saved, tickets auto-resolved, MTTR delta, and hours saved, so the question "what is this platform actually doing for us?" has a screen instead of a shrug.
Part seven is dedicated to this compounding effect, with concrete cross-connection examples.
The rest of the series
Each of the next six posts takes one step of the ladder and makes it concrete:
- Connect a cloud account, see dollar findings in five minutes
- Connect a repo, get your first PR review in minutes
- Connect Jira, get a toil analysis within the hour
- Connect PagerDuty, get an alert noise audit — then watch MTTR fall
- From runbooks to hours saved: automations that prove their own value
- The compounding effect: why every new connection makes the others smarter
Use the ladder on us
The ladder is a standard, and standards only matter if you can test them. The first rung takes five minutes and a read-only role.
Try CloudThinker free — 100 premium credits, no card required — pick whichever connection maps to your loudest problem in the connection guide, and see whether the first minute delivers. If it doesn't, you've lost five minutes. If it does, the next three rungs are already scheduled.